Here’s Where the Nasdaq 100 (QQQ) Can Go From Here

The Nasdaq 100 index (NASDAQ: QQQ) index has been the star performer of 2020 with a 46% performance. However, 2021 is proving to be a difficult year as year-to-date (YTD) performance went red at (-1.6%). The Nasdaq 100 was home to the pandemic winners as stay-at-home mandate and lockdowns spawned the acceleration of the migration to digital and cloud. The pandemic accelerated a decade’s worth of migration in less than a year’s time as businesses adopted digital transformation to adapt to work, play, learn, entertain-at-home lifestyles. The return to normal accelerated by COVID-19 vaccinations spurred a rotation out of growth back into value stocks which were hit the worst during the pandemic. The sell-off in the Nasdaq 100 index has been much worse than the S&P 500 index just because there’s more room for reversion. The market is again going through a price discovery period where it’s trying to figure out which pandemic stocks will remain a part of the “new normal” and which stocks were short-lived beneficiaries of a black swan event.
Nasdaq 100 지수 (NASDAQ : QQQ) 지수는 46 %의 성과로 2020 년 최고의 성과를 거두었습니다. 그러나 2021 년은 YTD (Year-to-Date) 실적이 -1.6 %로 하락하면서 어려운 한 해임을 입증하고 있습니다. Nasdaq 100은 집에 머물러야하는 의무와 잠금으로 인해 디지털 및 클라우드로의 마이그레이션이 가속화됨에 따라 대유행 우승자들의 본거지였습니다. 기업이 일, 놀이, 학습, 재택 생활 방식에 적응하기 위해 디지털 혁신을 채택함에 따라 전염병으로 인해 1 년 이내에 10 년간의 마이그레이션이 가속화되었습니다. COVID-19 백신 접종으로 인해 정상으로의 복귀가 가속화됨에 따라 대유행 기간 동안 최악의 상황에 처한 가치 주식으로 다시 성장하는 데 박차를가했습니다. Nasdaq 100 지수의 매도세는 복귀 여지가 더 많기 때문에 S & P 500 지수보다 훨씬 더 나빴습니다. 시장은 다시 어떤 대유행 주식이 '새로운 정상'의 일부로 남을지, 그리고 어떤 주식이 블랙 스완 이벤트의 단기 수혜자인지 파악하려는 가격 발견 기간을 다시 겪고 있습니다.
The Hare Versus Turtle 토끼와 거북이
Markets tend to overshoot extremely setting up reversions that can also turn into strong reversals. The pre-pandemic highs on the QQQ was $237.47. As the QQQ starts to breakdown, it’s important to keep things in perspective. While the Nasdaq 100 beat the S&P 500 performance in 2020, the shoe is on the other foot in 2021 as value is outpacing growth, very anecdotal to the hare versus tortoise tale. The S&P 500 is beating the Nasdaq 100 performance at 2.61% year-to-date (YTD) versus (-1.61%) respectively.
시장은 강한 반전으로 바뀔 수있는 반전 설정을 지나치게 설정하는 경향이 있습니다. QQQ의 전염병 전 최고치는 $ 237.47이었습니다. QQQ가 무너지기 시작하면 상황을 잘 파악하는 것이 중요합니다. Nasdaq 100이 2020 년 S & P 500 성능을 능가하는 반면, 가치가 성장을 앞지르는 2021 년에 신발은 다른 발에 있습니다. 토끼 대 거북이 이야기의 일화입니다. S & P 500은 각각 2.61 % (YTD) 대 (-1.61 %)로 Nasdaq 100 성능을 능가하고 있습니다.
New Normal Stickiness
As rotation into the value stocks concludes, the market will then revert again to the pandemic winners that have transformed into an embedded piece of the “new normal”. The components will be the leaders in the cloud, digital transformation, telemedicine, remote work and engagement, EVs and renewable and zero-emissions energy. The new “sin” stocks will be digital sportsbooks/iGaming and cannabis stocks as cash-strapped states find new revenues streams via regulation rather than prohibition.
가치 주로의 순환이 완료되면 시장은 "새로운 표준"의 내재 된 조각으로 변모 한 대유행 승자에게 다시 돌아갈 것입니다. 구성 요소는 클라우드, 디지털 변환, 원격 의료, 원격 작업 및 참여, EV 및 재생 가능 및 제로 배출 에너지의 리더가 될 것입니다. 새로운 "죄"주식은 디지털 스포츠 북 / iGaming 및 대마초 주식이 될 것입니다. 현금이 부족한 주에서는 금지가 아닌 규제를 통해 새로운 수입원을 찾을 수 있습니다.
Bearish Catalysts
The Nasdaq 100 shares the same fundamental bearish catalysts as the S&P 500 as it pertains to systemic risk. These range from interest rates and geopolitical threats to tariff wars, inflation, credit crisis, and or another pandemic. Some or all of these factors can lean the QQQs lower, but mostly act as the “reason” why the Nasdaq sold off.
Nasdaq 100은 시스템 리스크와 관련하여 S & P 500과 동일한 근본적인 약세 촉매제를 공유합니다. 금리와 지정 학적 위협부터 관세 전쟁, 인플레이션, 신용 위기 및 기타 유행병에 이르기까지 다양합니다. 이러한 요인 중 일부 또는 전부는 QQQ를 낮출 수 있지만 대부분 나스닥이 매진 된 "이유"로 작용합니다.
QQQ Price Trajectories
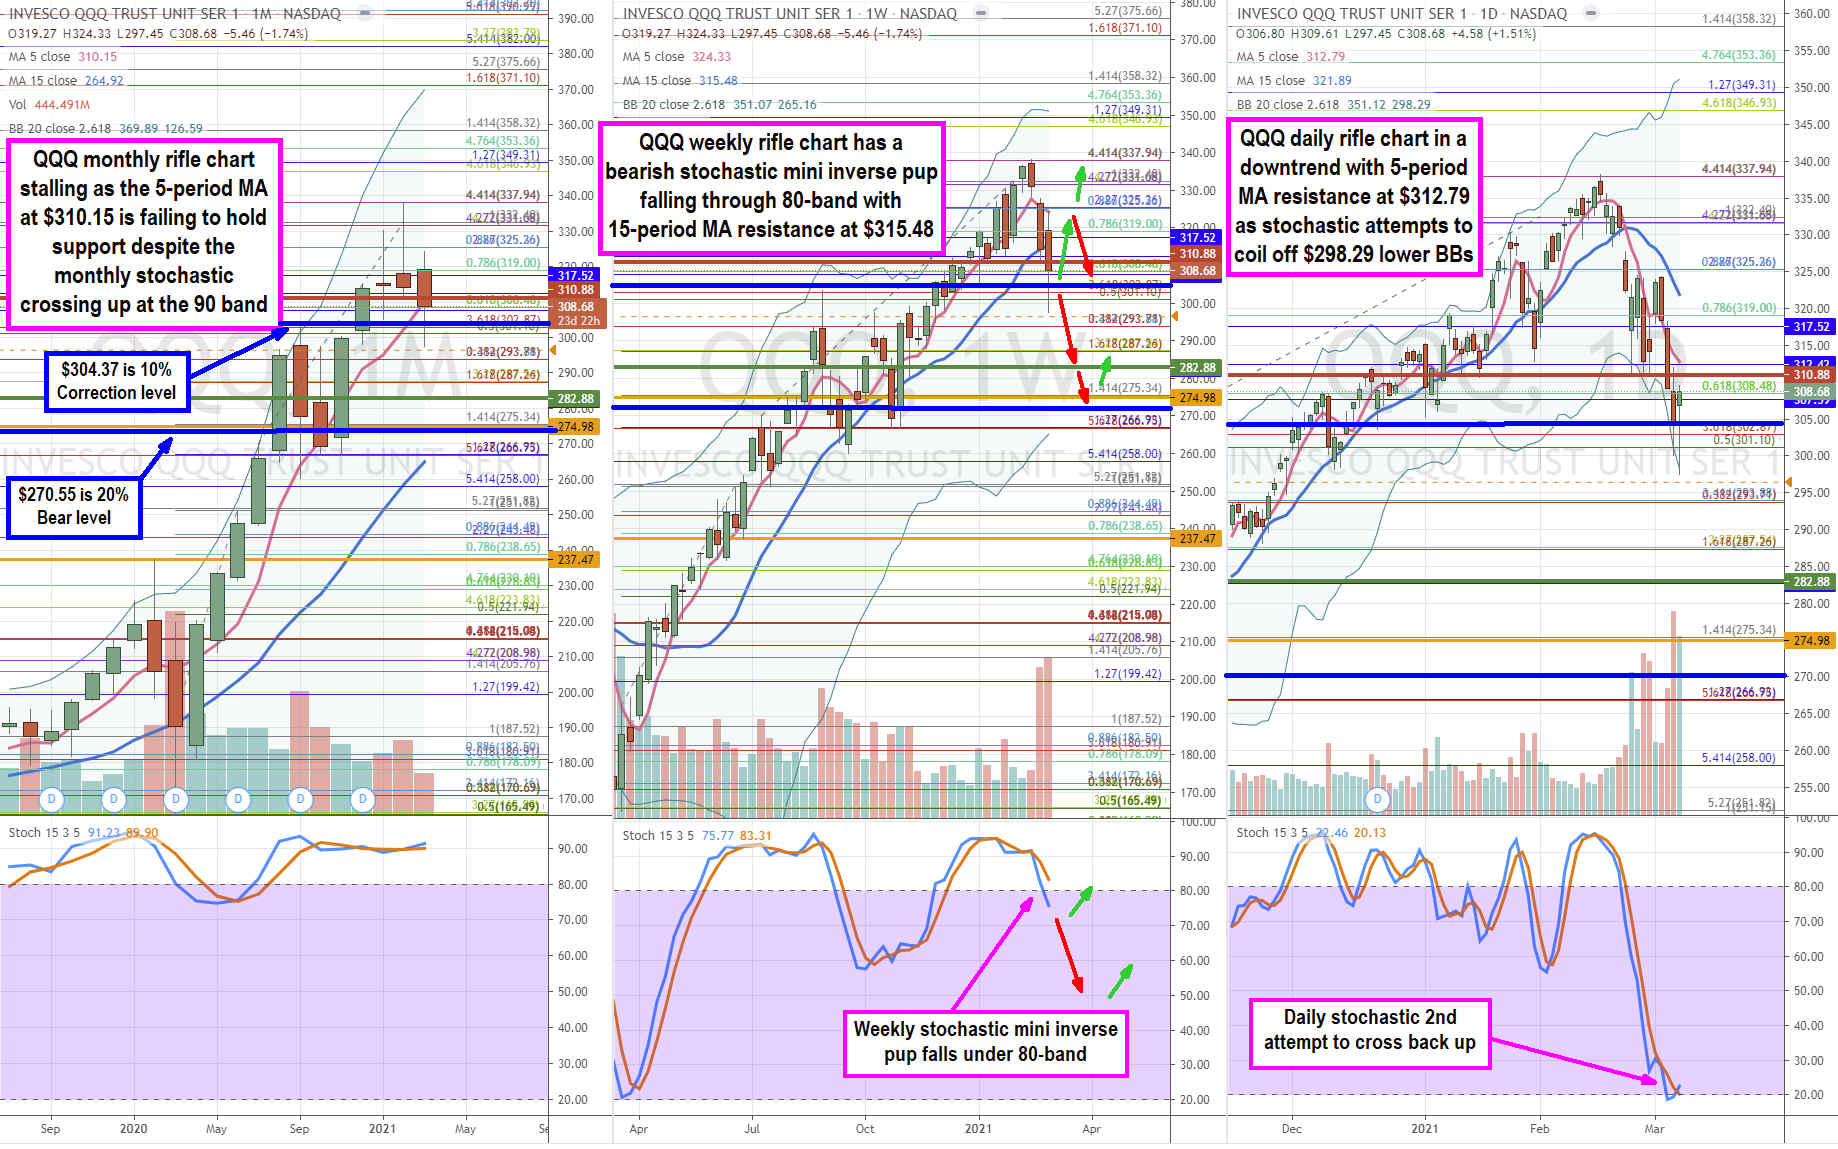
Using the rifle charts on monthly, weekly and daily time frames, we lay out the full near-term to longer-term playing field for the QQQ. The monthly rifle chart has been uptrending since surpassing its pre-COVID-19 highs in June 2020. The monthly uptrend has stalled out as the 5-period moving average (MA) flattens out at $310.55. The February shoot star candlestick sets the tone as March lows set the market structure high (MSH) sell trigger in April. So far, the low trigger has $297.45. The weekly rifle chart peaked out at the $337.94 Fibonacci (fib) level. The weekly 5-period MA is sloping down at $324.33 as the QQQ collapsed quickly through the weekly 15-period MA at $315.48 and has yet to retest that level. The weekly market structure high (MSH) sell triggered under the $310.88. The most dangerous component is the weekly stochastic mini inverse pup fell through the 80-band. The (-10%) correction level at $304.37 was tested and needs to hold support as a failure there can eventually set-up a move towards the (-20%) bear market level at $270.55 in the coming weeks. The daily rifle chart has been in a downtrend with a falling 5-period MA resistance at $312.79 and 15-period MA at $321.89. The daily stochastic is attempting to coil off the 20-band but needs to recover through the daily 5-period MA and 15-period MA to gain traction. The weekly 5-period MA at $324.33 seems daunting but needs to break back up through in order to offset the potential for a weekly breakdown. The near-term trajectory for the QQQ would be a rebound attempt back towards the weekly 15-period MA at $315.48 and 5-period MA at $324.33. The bull case could call for a move towards the daily and weekly upper BBs near $350 upside. If they reject, then a deeper sell-off first towards the $270.55 bear market level and then towards the weekly lower BBs at the $265.15 is the downside trajectory.
월별, 주별 및 일별 시간 프레임의 라이플 차트를 사용하여 QQQ에 대한 전체 단기 및 장기 경기장을 배치합니다. 월별 라이플 차트는 2020 년 6 월 코로나 19 이전 최고치를 넘어선 이후 상승세를 보이고 있습니다. 5 선 이동 평균 (MA)이 $ 310.55로 평평 해지면서 월별 상승 추세가 정체되었습니다. 2 월 슛 스타 캔들 스틱은 3 월 저점이 4 월에 시장 구조를 최고 (MSH) 매도 트리거로 설정함에 따라 톤을 설정합니다. 지금까지 낮은 트리거는 $ 297.45입니다. 주간 소총 차트는 $ 337.94 피보나치 (fib) 수준에서 정점을 찍었습니다. 주간 5 일 MA는 $ 324.33으로 하락하고 있습니다. QQQ가 주간 15 선 MA를 통해 $ 315.48로 빠르게 폭락했지만 아직 그 수준을 다시 테스트하지 않았기 때문입니다. 주간 시장 구조 최고 (MSH) 매도는 $ 310.88 미만에서 시작되었습니다. 가장 위험한 구성 요소는 주간 확률 적 미니 역 강아지가 80 밴드를 통과 한 것입니다. $ 304.37의 (-10 %) 수정 수준이 테스트되었으며 실패로 인해 향후 몇 주 내에 (-20 %) 베어 마켓 수준으로의 이동을 설정할 수 있으므로 지원을 유지해야합니다. 일일 소총 차트는 5 일 MA 저항이 $ 312.79, 15 일 MA 저항이 $ 321.89로 하락 추세를 보이고 있습니다. 일일 확률론은 20 대역을 감추려고하지만 견인력을 얻으려면 일일 5주기 MA와 15주기 MA를 통해 회복해야합니다. $ 324.33의 주간 5 기 MA는 벅찬 것처럼 보이지만 주간 고장 가능성을 상쇄하기 위해 다시 돌파해야합니다. QQQ의 단기 궤적은 주당 15 선 MA 인 $ 315.48과 5 선 MA $ 324.33을 향한 반등 시도가 될 것입니다. 강세 사건은 $ 350에 가까운 일간 및 주간 상위 BB 로의 이동을 요구할 수 있습니다. 그들이 거절한다면, 먼저 $ 270.55 베어 마켓 레벨을 향한 더 깊은 매도세가 그리고 $ 265.15에서 주간 낮은 BB를 향한 하락 궤도가됩니다.
www.marketbeat.com/originals/heres-where-the-nasdaq-100-can-go-from-here/
Here’s Where the Nasdaq 100 (QQQ) Can Go From Here
The Nasdaq 100 index (NASDAQ: QQQ) index has been the star performer of 2020 with a 46% performance. However, 2021 is proving to be a difficult year as year-to-date (YTD) performance went red at (-1.6%).
www.marketbeat.com
'Study English' 카테고리의 다른 글
| [Words] 답답하다 영어로 = frustrate (0) | 2021.03.13 |
|---|---|
| [News] Anheuser-Busch Inbev Stock is a Must Own Re-Opening Play (0) | 2021.03.12 |
| [News] 중국 국회의원, 홍콩에 대한 통제 강화지지 (0) | 2021.03.11 |
| [News] How to Make Money Online (0) | 2021.03.11 |
| [News] 3 Tech Stocks on Sale to Buy Carefully (0) | 2021.03.10 |


