
B2B Marketing Analytics: What’s Out-of-the-box? Dashboards, Lenses & Datasets – Part 1
Getting started with B2B Marketing Analytics can be overwhelming. As marketers, our success story is heavily reliant on the data. This series aims to demystify Salesforce’s Einstein Analytics for Marketers, taking you through how I get my clients up to speed, including creating datasets, lenses and dashboards and understanding how to leverage the data. Let’s help you get up to speed, so you can leverage B2B Marketing Analytics to tell your success story and take data-driven actions to maximize your sales and marketing efforts.
B2B 마케팅 분석을 시작하는 것은 부담 스러울 수 있습니다. 마케팅 담당자로서 우리의 성공 스토리는 데이터에 크게 의존합니다. 이 시리즈의 목표는 Salesforce의 마케팅 담당자를위한 Einstein Analytics를 이해하고 데이터 세트, 렌즈 및 대시 보드를 만들고 데이터를 활용하는 방법을 이해하는 것을 포함하여 고객에게 속도를 높이는 방법을 안내합니다. B2B 마케팅 분석을 활용하여 성공 사례를 전달하고 데이터 기반 조치를 취하여 영업 및 마케팅 노력을 극대화 할 수 있도록 속도를 높이는 데 도움이됩니다.
B2B Marketing Analytics comes with a surprising amount out-of-the-box that people don’t always dig into. Let’s take a step back and outline what dashboards come out of the box, the different pieces and components, so that you can put it all together to create your first dashboard in Part 2.
B2B 마케팅 분석은 사람들이 항상 파헤 치지 않는 놀라운 양의 기본 제공 기능을 제공합니다. 한 걸음 뒤로 물러나서 어떤 대시 보드가 상자에서 나오는지, 다른 부분과 구성 요소에 대해 간략히 설명해 보겠습니다. 그러면이를 모두 모아 파트 2에서 첫 번째 대시 보드를 만들 수 있습니다.
What is B2B Marketing Analytics?
The one-line pitch for B2B Marketing Analytics is: “the analytics app built for the B2B marketer”. In short, Pardot data (such as email engagement, visitor data), is packaged up and sent into the Einstein Analytics platform for visualisation and exploration.
B2B 마케팅 분석에 대한 한 줄 설명은 "B2B 마케팅 담당자를 위해 구축 된 분석 앱"입니다. 간단히 말해, Pardot 데이터 (예 : 이메일 참여, 방문자 데이터)는 시각화 및 탐색을 위해 패키지화되어 Einstein Analytics 플랫폼으로 전송됩니다.
Here is what you can do with B2B Marketing Analytics:
- Out-of-the-box dashboards: there’s a surprising amount that comes with the product, ready to go! Dashboards include Marketing Manager, Account-based Marketing, and Multi-touch Attribution.
- Out-of-the-box lenses and datasets
- Create and join additional datasets
- Create additional lenses
- Create bespoke dashboards
From what you just read above, you may be able to guess that B2BMA was designed with the marketer in mind who wants to ‘plug-in-and-play’. B2BMA is available for Pardot Advanced customers, and as an add-on for Pardot Plus organization.
위에서 읽은 내용에서 B2BMA는 '플러그인 앤 플레이'를 원하는 마케터를 염두에두고 설계되었음을 짐작할 수 있습니다. B2BMA는 Pardot Advanced 고객과 Pardot Plus 조직의 추가 기능으로 사용할 수 있습니다.
Out-of-the-box Dashboards
Let’s get started by walking through the out of the box dashboards that come with B2B Marketing Analytics, the purpose of each, and the metrics that come along with each dashboard.
B2B Marketing Analytics와 함께 제공되는 즉시 사용 가능한 대시 보드, 각각의 목적, 각 대시 보드와 함께 제공되는 메트릭을 살펴보면서 시작해 보겠습니다.
1. Pipeline Dashboard
This dashboard shows your sales funnel from the visitor stage to prospects to the opportunities won/lost. You can leverage this dashboard for sales and marketing leadership as a tool to see which assets and campaigns are influencing the most deals.
이 대시 보드는 방문자 단계에서 잠재 고객, 성공 / 실패 기회까지의 판매 퍼널을 보여줍니다. 영업 및 마케팅 리더십을 위해이 대시 보드를 도구로 활용하여 어떤 자산과 캠페인이 가장 많은 거래에 영향을 미치는지 확인할 수 있습니다.
It includes the following metrics: numbers of visitors, prospects, marketing qualified leads, open opportunities, closed-won opportunities, and velocity figures.
여기에는 방문자 수, 잠재 고객, 마케팅 적격 리드, 공개 기회, 마감 기회 및 속도 수치와 같은 메트릭이 포함됩니다.

2. Engagement Dashboard:
- Looks specifically at your marketing assets like forms and landing pages and their performance and how they contribute to the sales pipeline and opportunity lifecycle.
- It includes the following metrics: asset engagement on list emails, forms, and landing pages.
특히 양식 및 랜딩 페이지와 같은 마케팅 자산과 그 성과 및 이들이 판매 파이프 라인 및 기회 수명주기에 어떻게 기여하는지 살펴 봅니다.
여기에는 목록 이메일, 양식 및 랜딩 페이지에 대한 자산 참여와 같은 메트릭이 포함됩니다.
Below are the sections of the dashboard, they can be filtered by selecting either one or multiple campaigns
아래는 대시 보드의 섹션이며 하나 또는 여러 캠페인을 선택하여 필터링 할 수 있습니다.

The above section of the engagement dashboard shows you all of your email engagements with data including: total emails sent, the open rate, the number of unique clicks, bounces, opt outs, and undelivered messages.
참여 대시 보드의 위 섹션은 전송 된 총 이메일 수, 오픈 비율, 고유 클릭 수, 반송 메일, 수신 거부 및 배달되지 않은 메시지를 포함한 데이터와 함께 모든 이메일 참여를 보여줍니다.
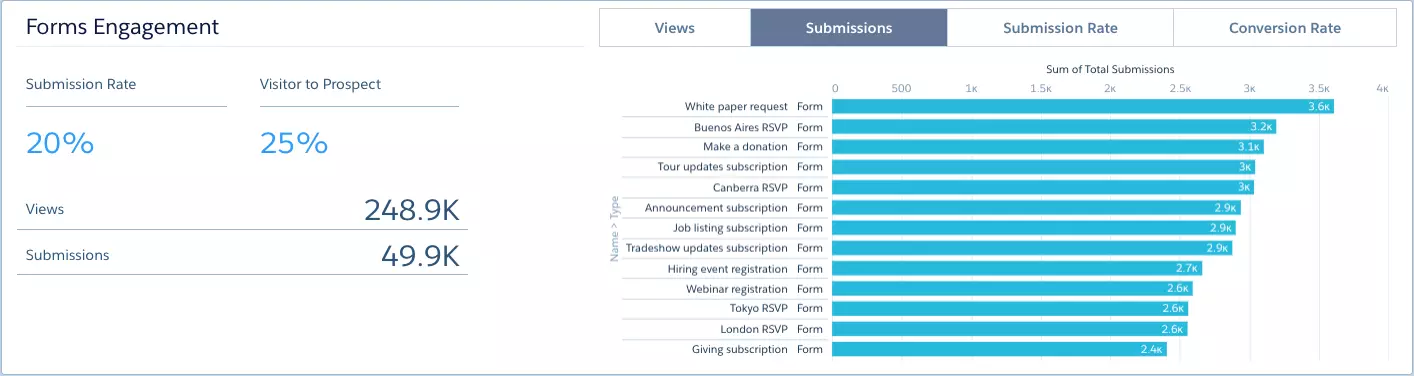
This next section shows you your form engagement, with data points including submission rates, visitor to prospect rates, and views.
이 다음 섹션에서는 제출 비율, 잠재 고객 비율 및 조회수를 포함한 데이터 포인트와 함께 양식 참여를 보여줍니다.

This final section provides you with a view into your landing pages and their unique views, total submission rates, total submits, and total views.
이 마지막 섹션에서는 랜딩 페이지와 해당 고유보기, 총 제출 비율, 총 제출 및 총보기에 대한보기를 제공합니다.
3. Marketing Manager:
- This dashboard is a combination of the engagement and pipeline dashboard and allows you to get a quick look at the health of your business and your campaign performance.
- It includes the following metrics: pipeline deals, revenue by campaign, and marketing asset engagement.
이 대시 보드는 참여와 파이프 라인 대시 보드의 조합이며 비즈니스 상태와 캠페인 성과를 빠르게 확인할 수 있습니다.
여기에는 파이프 라인 거래, 캠페인 별 수익 및 마케팅 자산 참여와 같은 메트릭이 포함됩니다.

There are two additional dashboards that are optionally available with B2B Marketing Analytics. During the setup, it will ask you if you’d like to enable them.
B2B Marketing Analytics에서 선택적으로 사용할 수있는 두 개의 추가 대시 보드가 있습니다. 설정하는 동안 활성화할지 묻는 메시지가 표시됩니다.
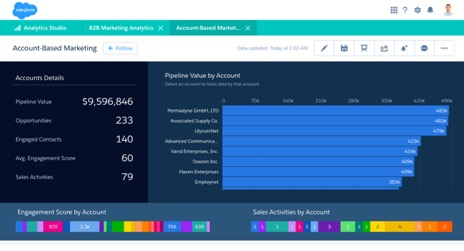
4. Account Based Marketing:
- This particular dashboard helps you understand opportunities and contacts from one account that engages with your marketing and sales assets.
- It includes the following metrics: account details, pipeline by account, revenue win percentage, stage value by account, and sales activity as it relates to time spent on activities and number of sales activities.
이 특정 대시 보드는 마케팅 및 판매 자산과 관련된 하나의 계정에서 기회와 연락처를 이해하는 데 도움이됩니다.
여기에는 계정 세부 정보, 계정 별 파이프 라인, 수익 창출 비율, 계정 별 단계 값, 활동에 소요 된 시간 및 판매 활동 수와 관련된 판매 활동과 같은 메트릭이 포함됩니다.
5. Multi-touch Attribution Dashboard:
- The multi-touch attribution dashboard shows you which marketing efforts are most influential during each stage of the buying lifecycle. This dashboard allows you to view the data by 3 attribution types: first touch, even distribution, and last touch.
- It includes the following metrics: revenue, total value, cost, ROI, top campaigns, and revenue by channel.
멀티 터치 어트 리뷰 션 대시 보드는 구매 라이프 사이클의 각 단계에서 가장 영향력있는 마케팅 활동을 보여줍니다. 이 대시 보드를 사용하면 첫 번째 터치, 균등 분포, 마지막 터치의 3 가지 속성 유형별로 데이터를 볼 수 있습니다.
여기에는 수익, 총 가치, 비용, ROI, 인기 캠페인 및 채널 별 수익과 같은 메트릭이 포함됩니다.

Out-of-the-box Lenses
Salesforce defines your lens as a particular view into a dataset’s data. You use a lens to do exploratory analysis and visualization. You’ll have four standard lenses as part of B2B Marketing analytics:
Salesforce는 렌즈를 데이터 세트의 데이터에 대한 특정보기로 정의합니다. 렌즈를 사용하여 탐색 적 분석 및 시각화를 수행합니다. B2B 마케팅 분석의 일부로 4 개의 표준 렌즈가 있습니다.
- Pipeline Deals
- Campaigns (Pardot Campaigns)
- Lead Sources
- Lifecycle Snapshot
Out-of-the-box Datasets
You’ll also get Pardot datasets ready for use. A dataset, defined by Salesforce, contains a set of source data that is formatted and optimized for interactive exploration. The data pulls data right from your Pardot instance. The following datasets are currently available:
또한 Pardot 데이터 세트를 사용할 수 있습니다. Salesforce에서 정의한 데이터 세트에는 대화 형 탐색을 위해 형식이 지정되고 최적화 된 소스 데이터 세트가 포함됩니다. 데이터는 Pardot 인스턴스에서 바로 데이터를 가져옵니다. 현재 다음 데이터 세트를 사용할 수 있습니다.
- Pardot Campaigns
- Pardot Emails
- Pardot Email Templates
- Pardot Forms and Form Handlers
- Pardot Landing Pages
- Opportunity
- Tag
- Visitor
- Prospect
- Multi-touch Attribution (Shared App)
- Campaign Influence Models (Shared App)
- ABM Opportunities (Shared App)
- ABM Contacts (Shared App)
- ABM Events (Shared App)
For a more detailed list of Pardot B2BMA datasets, dataset metrics, and descriptions of each, you can check out this knowledge article.
Pardot B2BMA 데이터 세트, 데이터 세트 메트릭 및 각각에 대한 설명의 자세한 목록은이 지식 문서를 확인하십시오.
Summary
With the out of the box assets, B2B Marketing Analytics can help marketers visualize their campaign ROI across the funnel. We can already see what channels and what programs are generating revenue. With the multi-touch attribution dashboard we can even see which campaigns are driving ROI from an awareness perspective, across all buying stages, and last touch, which shows us what programs are really helping to drive deals to close. B2B Marketing Analytics, provides you with great out of the box visualizations to get started telling your marketing data success story.
즉시 사용 가능한 자산을 통해 B2B Marketing Analytics는 마케팅 담당자가 퍼널 전반에 걸쳐 캠페인 ROI를 시각화하는 데 도움이 될 수 있습니다. 어떤 채널과 어떤 프로그램이 수익을 창출하는지 이미 알 수 있습니다. 멀티 터치 어트 리뷰 션 대시 보드를 사용하면 모든 구매 단계 및 마지막 터치에서 인지도 관점에서 어떤 캠페인이 ROI를 유도하고 있는지 확인할 수 있으며, 이는 거래를 성사시키는 데 실제로 도움이되는 프로그램을 보여줍니다. B2B 마케팅 분석은 마케팅 데이터 성공 사례를 전달하기 시작하기 위해 즉시 사용할 수있는 뛰어난 시각화를 제공합니다.
B2BMA is included in specific packages if you don’t have it reach out to your account executive. For help in getting started, reach out to us here, for a complimentary consult, we’d love to help!
B2BMA는 계정 담당자에게 연락하지 않은 경우 특정 패키지에 포함됩니다. 시작하는 데 도움이 필요하면 여기에서 문의하세요. 무료 상담이 필요하면 기꺼이 도와 드리겠습니다.
B2B Marketing Analytics: What’s Out-of-the-box? Dashboards, Lenses & Datasets - Part 1 | THE DRIP
Share this article...Getting started with B2B Marketing Analytics can be overwhelming. As marketers, our success story is heavily reliant on the data. This series aims to demystify Salesforce’s Einstein Analytics for Marketers, taking you through how I g
salesforceben.com
'Salesforce' 카테고리의 다른 글
| [Salesforce] Pardot - 대규모 맞춤형 B2B 마케팅 (0) | 2021.03.11 |
|---|---|
| [Salesforce] 처음으로 취득해야 할 Marketing Cloud 자격증은? (0) | 2021.03.10 |
| [Salesforce] Pardot Set Up B2B Marketing Analytics (0) | 2021.03.09 |
| [Salesforce] Pardot Prerequisites for B2B Marketing Analytics (0) | 2021.03.09 |
| [Salesforce] Pardot B2B Marketing Analytics Dashboards (0) | 2021.03.09 |


